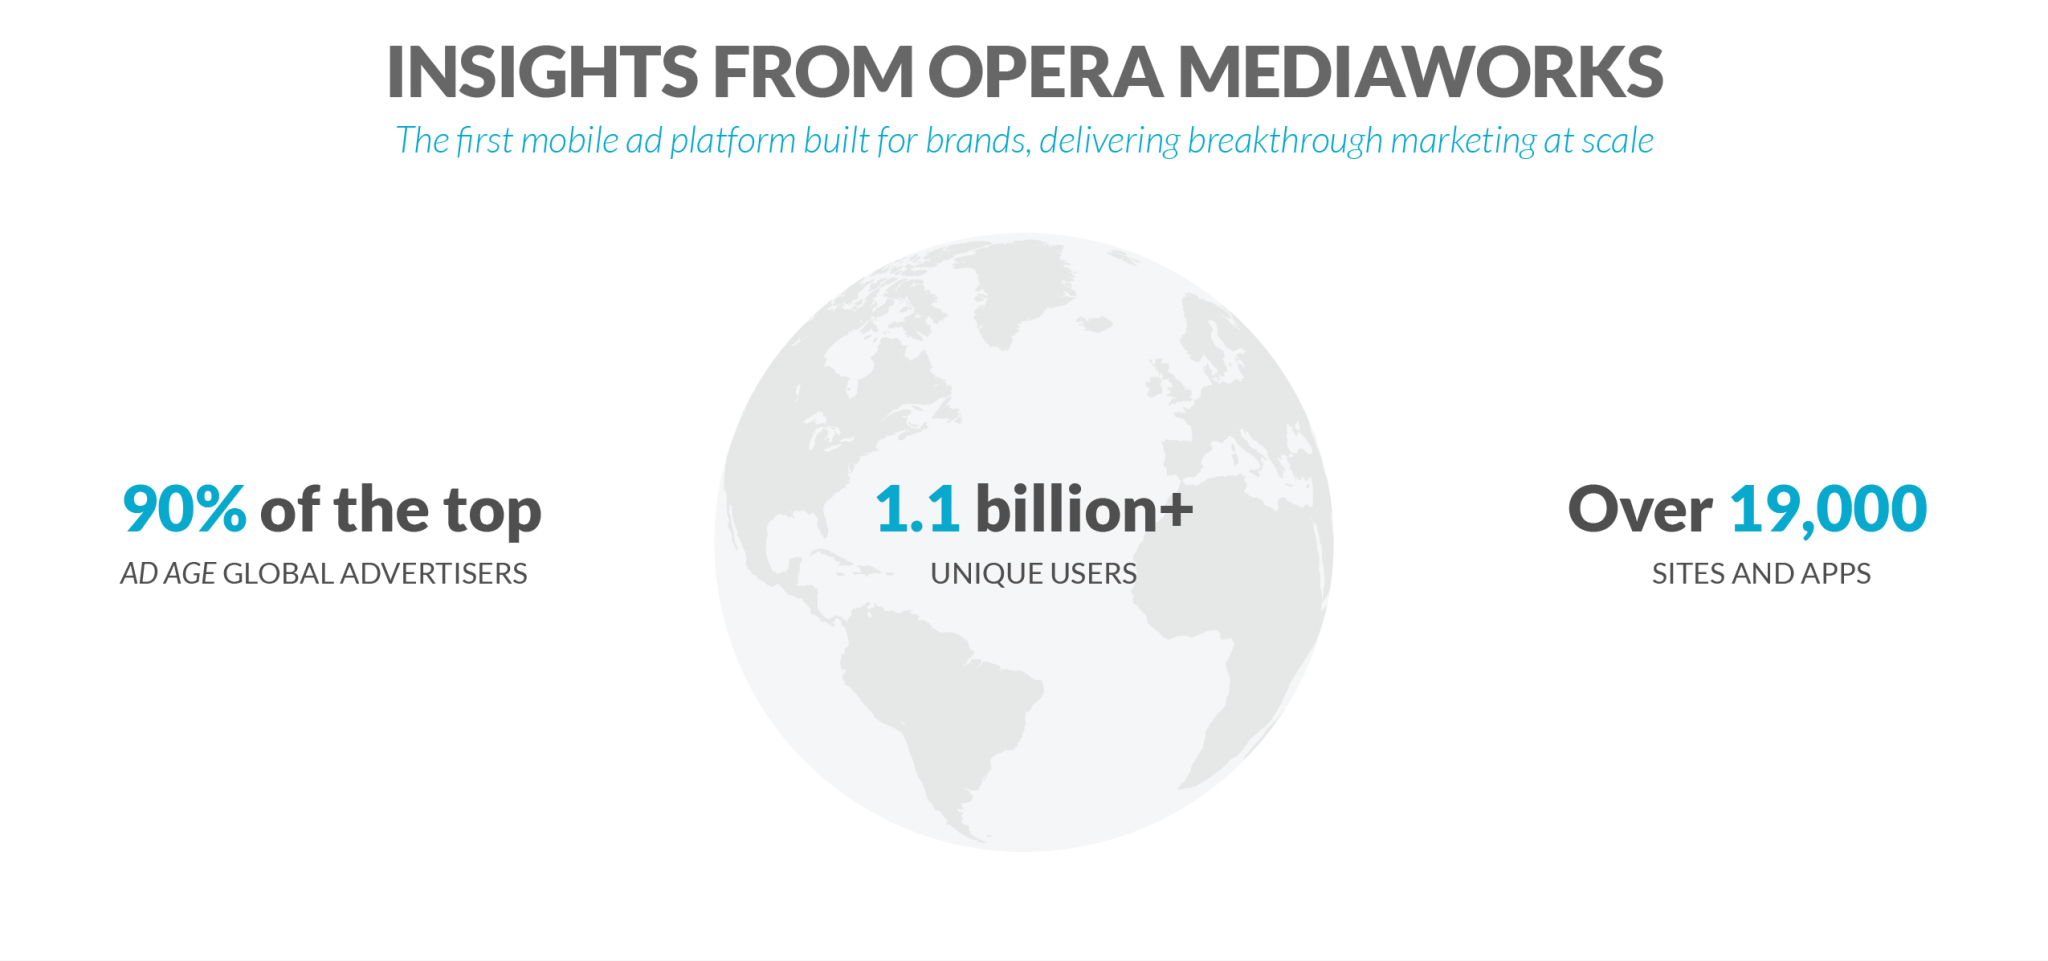
Insights from Opera Mediaworks
Highlights for the third quarter of 2014
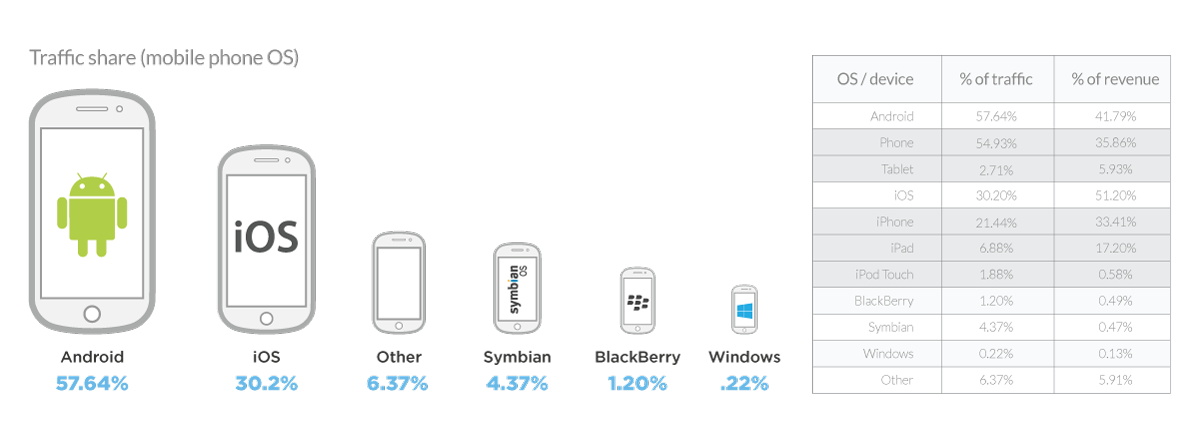
Android keeps marching on
Starting with the fourth quarter of 2013, each new State of Mobile Advertising report revealed another area where Android supplanted iOS as the market-leading operating system for mobile devices.
This quarter, Android continues to lead in traffic, with 57.6% market share of traffic, compared to 30.2% for iOS.
Android is beginning to close the gap in revenue, gaining three percentage points to reach 41.8% of revenue. Still, iOS continues to lead, accounting for 51.2% of all revenue generated on the platform.
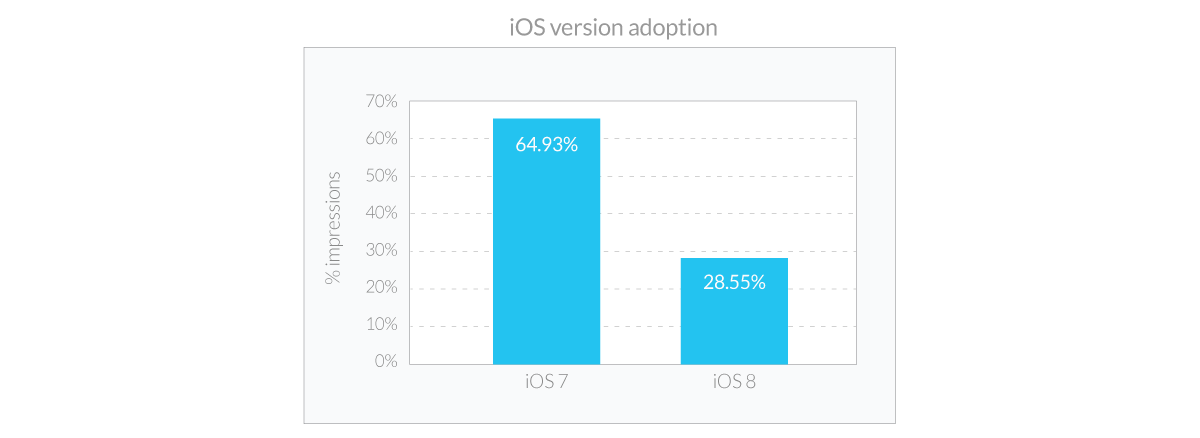
One of the highlights of the third quarter was Apple’s release of iOS 8. This year’s release, unlike last year’s (iOS 7) showed a remarkably slow adoption rate. As shown in the chart below, one week after its release in September of 2013, iOS 7 accounted for almost 65% of all impressions served to Apple devices, compared to 28.6% of impressions achieved by iOS 8 the week after its availability last month.
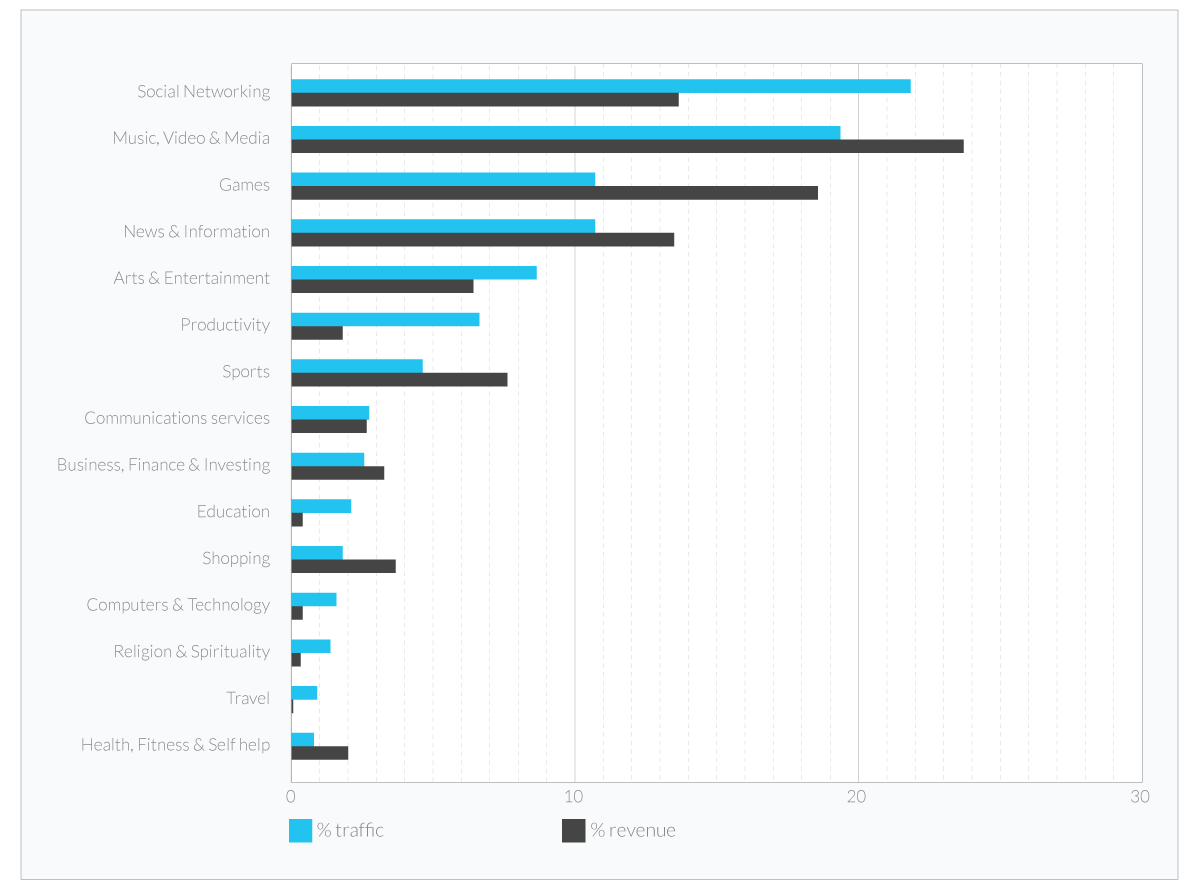
Social still no. 1 for traffic volume; Music, Video & Media leads revenue
Historically, the Social Networking category has captured the highest volume of impressions, and Music, Video & Media has taken the top spot for revenue generation. This quarter is no different, with 21.8% of impressions served to social networking sites and apps and 23.1% of revenue coming from music, video and media publishers.
Health, Fitness & Self Help retains the no. 1 position for its ability to monetize traffic, with revenue that is 2X its impression share. Sports, Shopping and Business, Finance & Investing also have significantly higher revenue capabilities compared to their relative traffic volume.
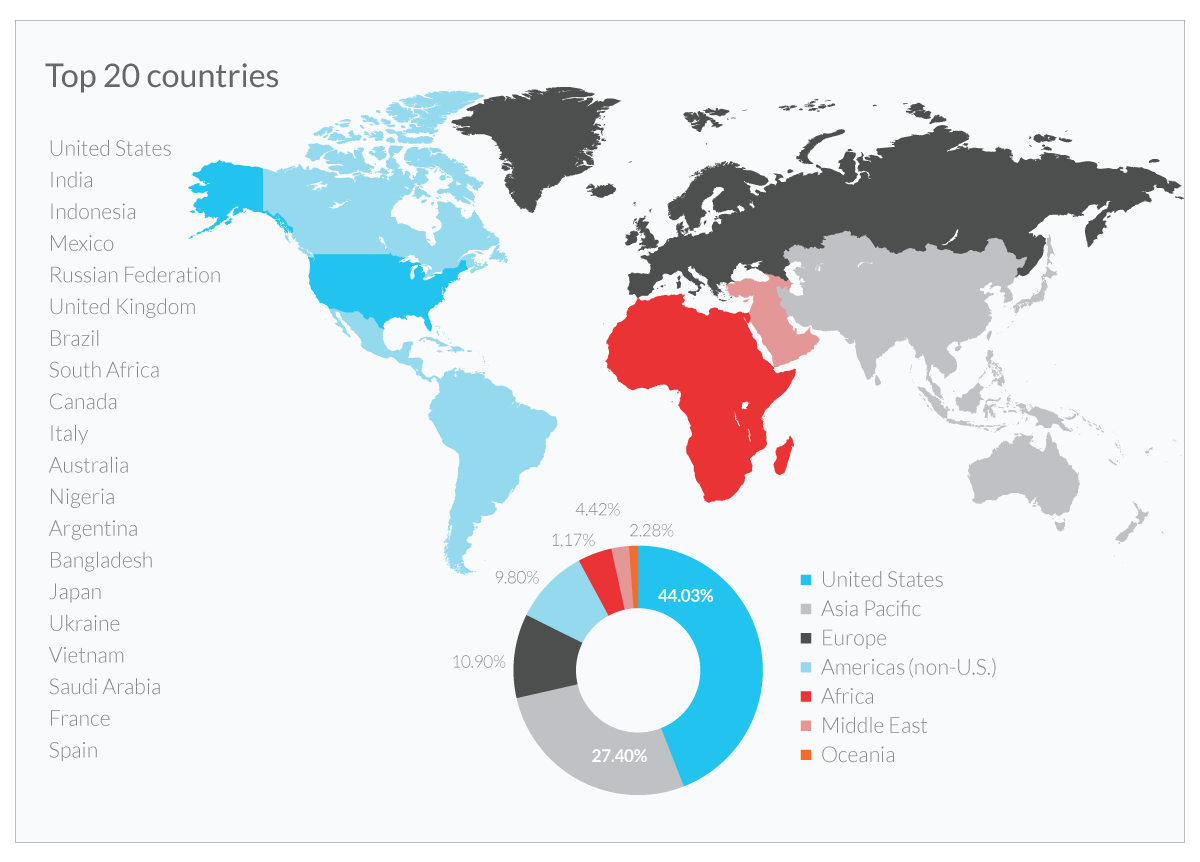
A breakout quarter for mobile advertising in the Americas
In Q2, we noted that 2014 was a big year for Asia, as it overtook Europe for the no. 2 spot for ad impressions. Year-over-year, it has nearly doubled its share, from 15.3% in Q3 2013 to the 27.4% it is today. However, revenue gains have been slower, from 4.9% last year to its current 8.4%. Europe generates a much higher percentage of revenue (17.3%), trailing just the United States for monetization potential.
Heading into the final quarter of the year, however, we’ve noticed that the Americas, the Western Hemisphere not including the U.S.A., is emerging as a robust mobile advertising market. Since just last quarter the region has nearly doubled its share of impressions, from 5.8% last quarter to 9.8% this quarter.
Also significant is the fact that the Americas’ share of total revenue exceeds its market share of impressions served, accounting for 10.3% of the revenue managed by our platform. Mexico is the major contributor to the region’s newfound success, jumping from no. 10 on our list of top 20 countries to no. 4. Argentina is also a large driver of growth, as it now joins Mexico, Brazil and Canada in our top 20 list.
Video: the rising star of the mobile ad world
Mobile video impression share: 3.5X so far in 2014
As the mobile advertising market continues to mature, rich media and video advertising are taking an ever-increasing share of impressions and revenue. While these ad formats have been available for a number of years, only recently have we seen them enter a period of rapid growth.
In Q1 of this year, we reported that 11% of our global ad impressions were rich media – with 2.5% being video. At the close of this quarter, over 15% of our total global traffic is rich media, with 8.7%, more than half of all rich media, coming from video formats.
These impressive numbers are even more so because this large percentage increase came during a period of significant growth in less developed markets where mobile advertising traffic is dominated by simple banners and little video.
1 in 10 mobile ads in the U.S. are now video
Mobile video ad success relies heavily on consumers having advanced devices and networks that support high bandwidth and low latency. It also demands a market where advertisers have sufficient incentive to spend the resources necessary to develop and run a video campaign. Because of these factors, we see very different usage patterns from country to country.
The chart below shows our top 20 countries (as measured by ad impressions delivered) for their usage of video advertising as compared to the global average of 8.7%. France bests all countries in that over 34% of the advertisements delivered are mobile video. Spain and Italy are also high, with mobile video comprising 27.9% and 17.5% of ads, respectively. The U.S. is slightly above the average, at 10.5%.
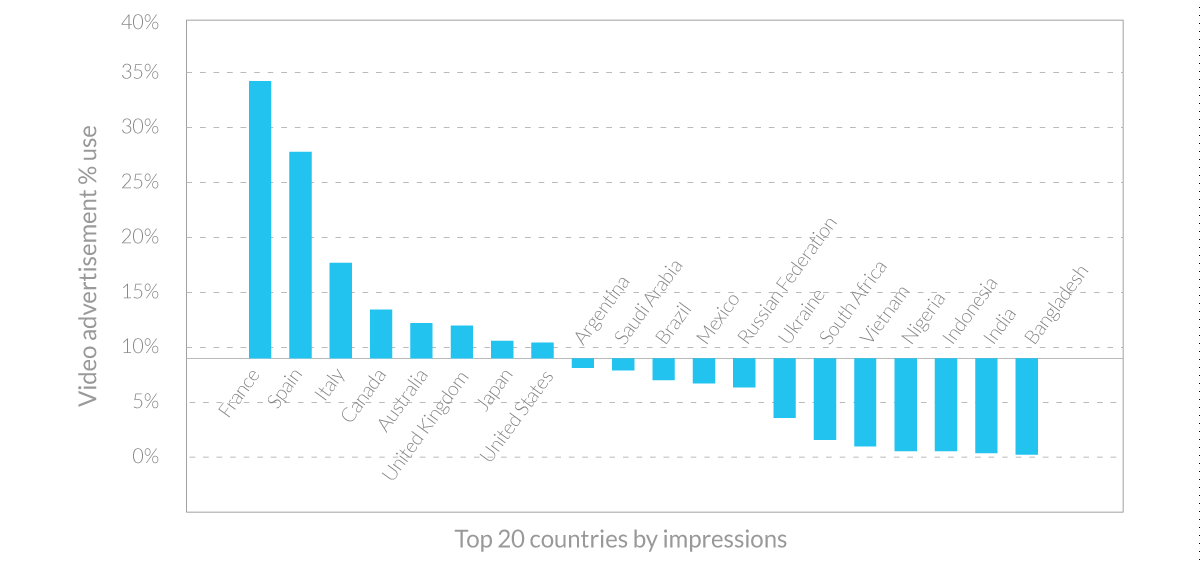
As discussed above, the markets in which there are fewer advanced devices and/or more constrained marketing capital or network capacities have less than the global average.
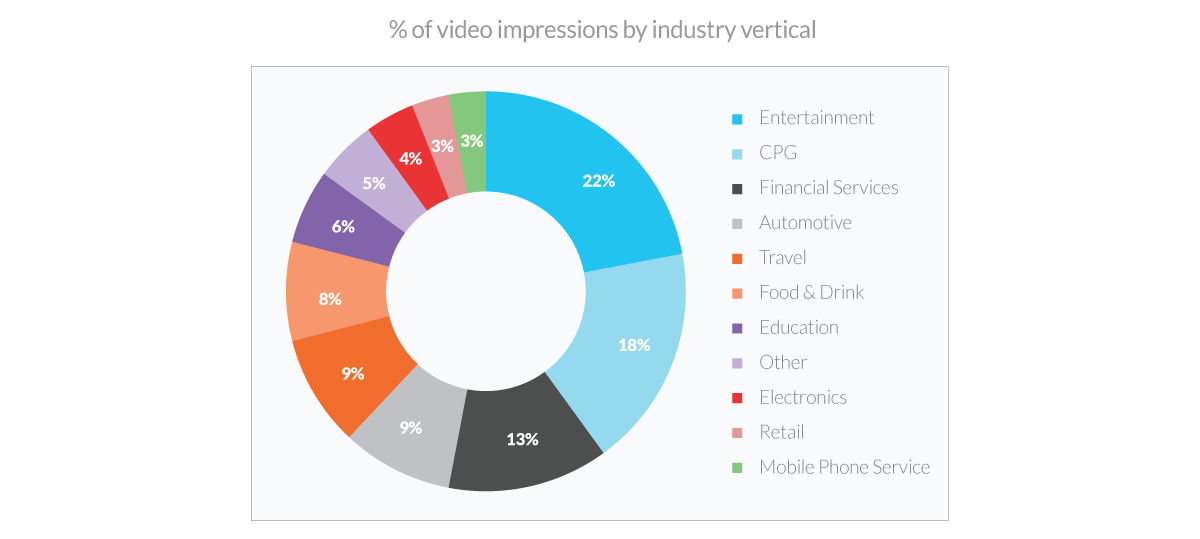
Entertainment, CPG and Financial Services are top users of mobile video
Advertisers are drawn to the video format for its ability to engage consumers with compelling brand messages and calls to action, and some verticals show more clear adoption than others. Entertainment is the most common user of mobile video, with 22% of impressions. Consumer packaged goods (CPG) follows with 18%.
This chart shows the share of video impressions by the advertiser’s industry vertical.
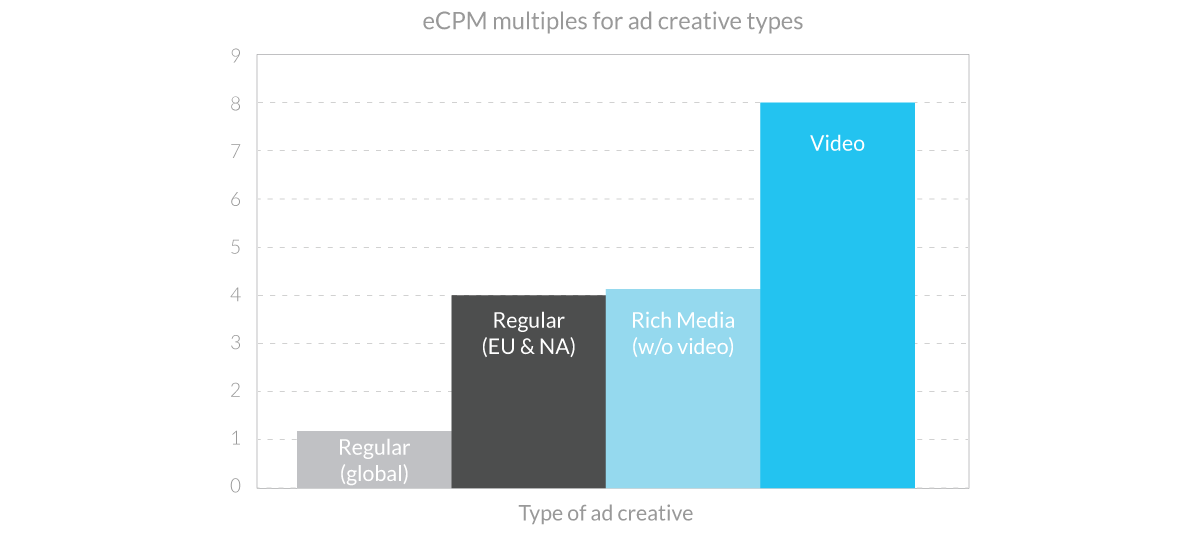
Mobile video monetization tips the scale
Mobile media publishers also find mobile video lucrative. Because video is so successful at communicating a brand’s emotional benefits, like TV, with sight sound and motion, advertisers are willing to pay a premium to place their creative with the right audience.
The chart below shows the multiples in eCPM video demands over our global average eCPM. As shown, video yields almost eight times (8X) the eCPM that a regular banner ad garners. However, as we discussed earlier, mobile video is much more prevalent in more mature advertising markets. We therefore also compared the video eCPM to rich media and regular banners ads delivered into those mature markets. In this comparison, video still achieves twice the eCPM of regular banner ads.
The device (and network) effect
As frequently stated, device capability plays a key role in the success of mobile video as an advertising medium. Regions that remain in transition between older “feature phone” technology and more modern “smartphones” tend to lag in adoption of video. Similarly, markets with networks where coverage, bandwidth or latency issues exist find it challenging to deliver video in a way that pleases consumers.
The table below summarizes traffic for video and total global impressions by operating system and device form factor. For this analysis we removed “feature phone” impressions from the global analysis.
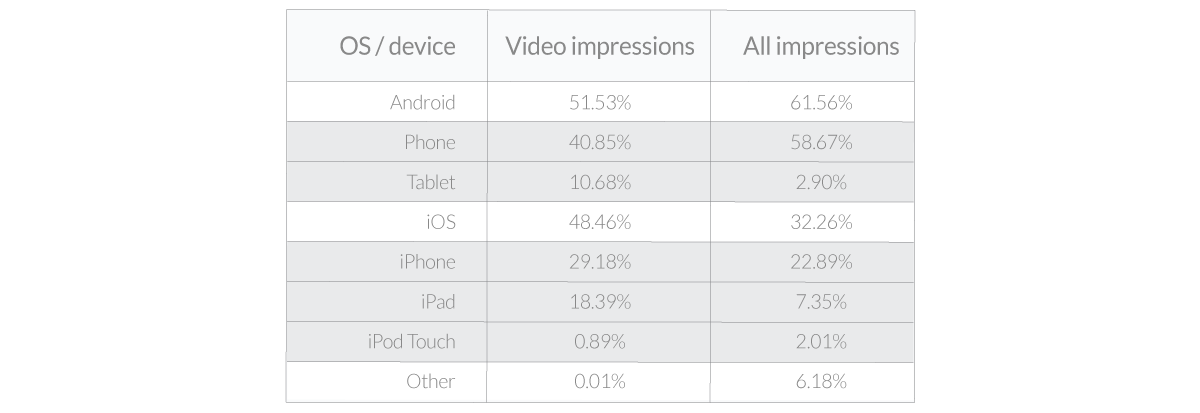
The most significant observations from the table is that Apple’s iOS significantly “overclocks” for video impressions as compared to all impressions served, by accounting for slightly over 48% of video impressions compared to 32% of all smartphone impressions. In a similar manner, we can see that tablets (Android tablets and the iPad) account for more video ad impressions than their overall market share. This highlights the fact that devices with improved viewing experiences accelerate the adoption of mobile video advertising.
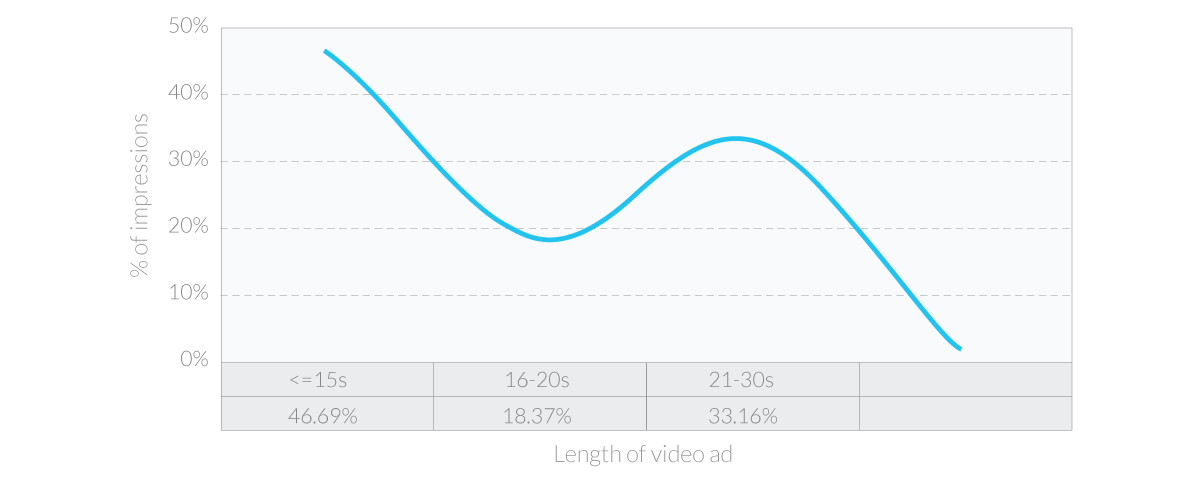
Mobile video creative – what’s the ideal length?
Of course, a key driver of mobile video advertising success is the video content itself. Even if the content is delivered to the right audience with the right device at the right time and place, the ad message must be compelling.
One critical decision the advertiser must make is to define the length of the video. Our experience shows that the most popular length for a video advertisement is extremely short (less than or equal to 15 seconds). These short videos are used extensively to support various marketing goals ranging from driving brand awareness to purchase intent.
Opera Mediaworks welcomed AdColony to the family in Q2 2014. In our first full quarter post-acquisition, we’re showcasing AdColony’s mobile video data and expertise in a special mobile video breakout section.
Growth of the short-form
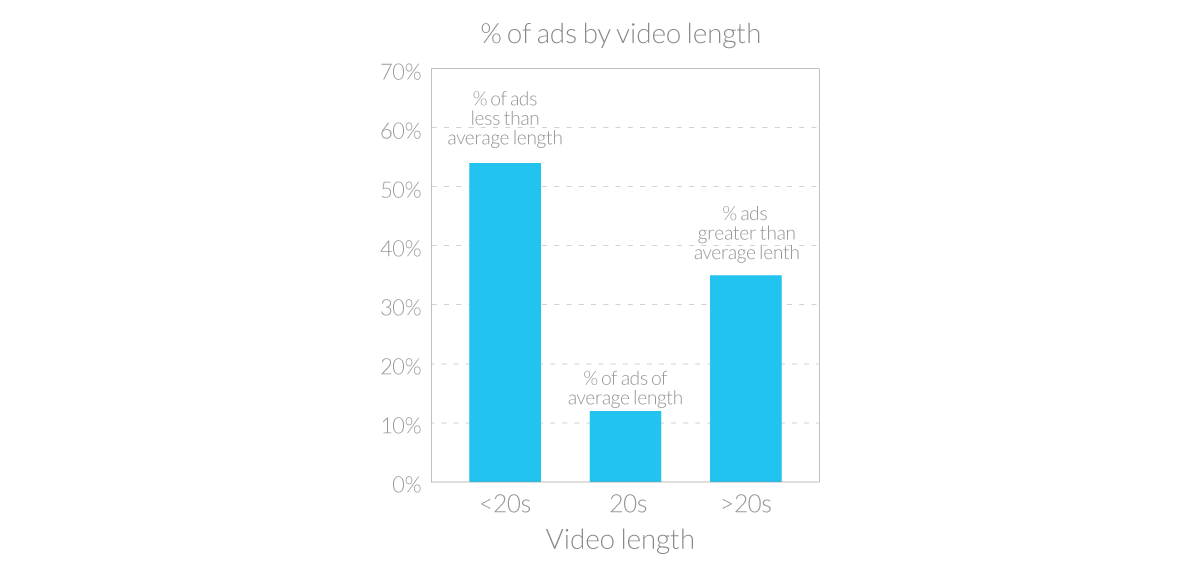
Just as impression volume favors ads 15-seconds or less, shorter videos continue to be the leader in terms of overall spending.
Investments in shorter-form video formats (10-14s and 15-19s) are growing exponentially. Perhaps it’s the influence of Vine and Instagram, but advertisers are spending more on shorter-form videos – and users are responding. Currently the average length of all video impressions is 20.6s. However, based on number of impressions, short form videos dominate. As the chart below shows, approximately 11% of our impressions are of average length. A full 53% are shorter than average while 35% are longer.
Summer seasonality
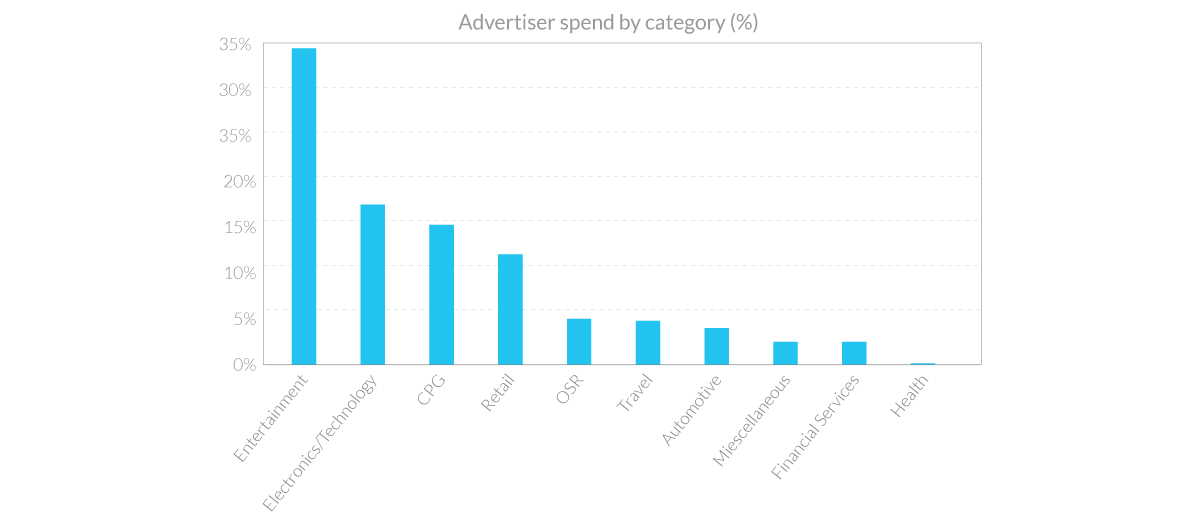
In the third quarter, brands invested in in-app mobile video across many advertising categories; however, Entertainment, CPG, Retail and the Electronics/Technology saw the highest concentration of spend across apps powered by AdColony.
Summer blockbuster movie premieres, fall network TV show launches, back-to-school shopping for kids and the release of new mobile devices and technologies were likely key drivers in these front-running advertiser categories for mobile video.
Hot app categories for mobile video
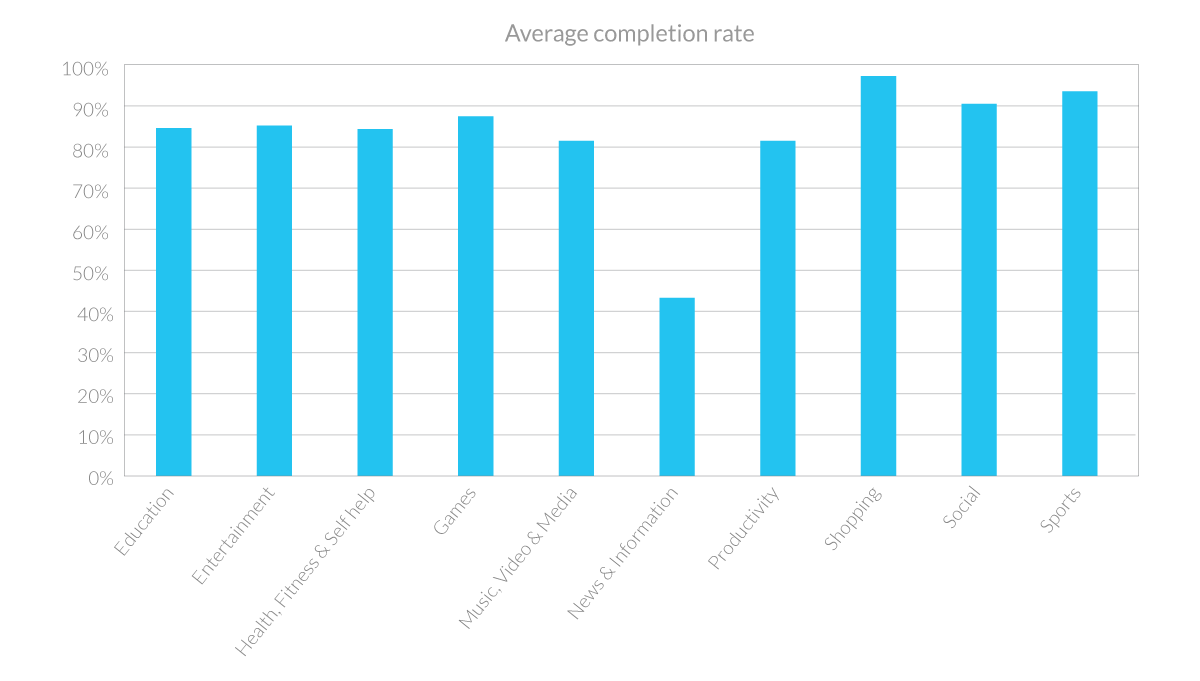
Video ad completion rates were high across the entire ecosystem, with a few app categories seeing relatively higher completion rates than others. Apps in the Shopping, Sports, Social and Health & Fitness categories saw the strongest mobile video ad completion rates.
Great content combined with well-integrated video ad placements tend to drive the best consumer engagement and completion rates.
Campaign Spotlight
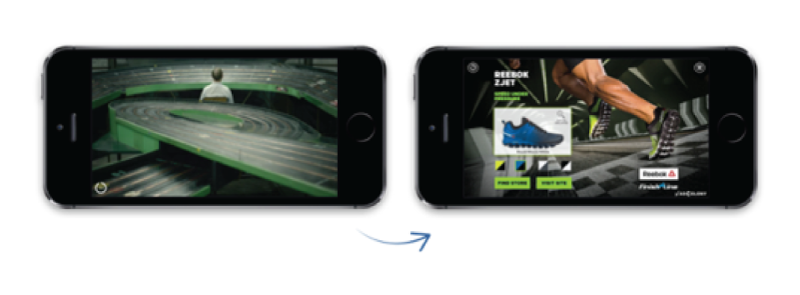
Great video + high post-view engagement = results for Reebok
The beauty of mobile video doesn’t just reside with the creative itself; the opportunity for brands to drive specific engagement after the video is viewed makes it a unique and attractive platform.
One strong example of this post-view engagement in Q3 was a campaign by Reebok to launch their new ZJET shoe.
The goal:
Build awareness and consideration of its Finish Line-exclusive ZJET shoe. Great content combined with well-integrated video ad placements tend to drive the best consumer engagement and completion rates.

The target audience:
Male fitness enthusiasts age 18-29 that are “glued to their smartphones”
The strategy:
Reebok & Carat teamed up with AdColony to deliver Reebok’s ad in contextually relevant environments (e.g. fitness, sports, tech) and to behaviorally-target tech & social mavens.
A rich media “End Card” followed the video ad, giving consumers the ability to learn more about the shoe, choose their favorite color, and even discover local pricing & availability (via an integration with hyper-local shopper marketing platform Retailigence).
The combination of HD video and the post-view interaction meant that Reebok was able to take consumers through the entire purchase process (from awareness to product exploration to in-store availability) all within a single ad unit.
The results:
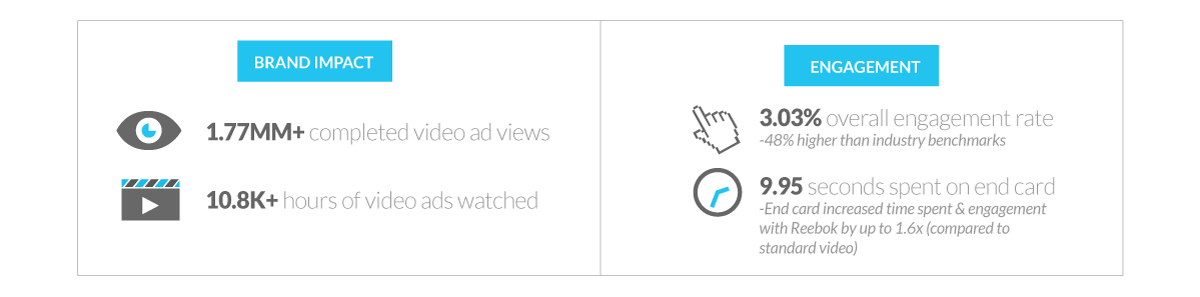
In addition, 8% of users expressed interest in learning more about the Finish Line-exclusive shoe by tapping on “Visit Site” and “Find Store” call-to-action buttons.
View recap of the Reebok campaign: https://vimeo.com/105995315