Android leads in traffic and revenue generation, but iOS is still on top for monetisation
 By Sarah Mitchell


 The first and last app of the day
How are consumers using mobile apps today? It is a question that everyone, from the advertising industry to those in the media and financial markets, seems to be interested in. We all have our eyes, too, on the markets created by this booming app ecosystem.
In our recent special report on Intelligent Audience Creation, we uncovered some of the differences in how mobile consumers use apps over the course of a week and also during a typical 24-hour time period. Here, we sought to identify the most common first “app of the day,” or the first app users access when they wake up in the morning, and last app of the day, which would be the last app accessed.
Based on our analysis of our audience in the United States, the first app of the day is in the Social Networking category, and the most common last app of the day is for Entertainment.
We also found that most users have a variety of “first” and “last” apps over the course of the month. We therefore assigned a “loyalty” score to each app based on how frequently users returned to that app category for their first or last app choice.
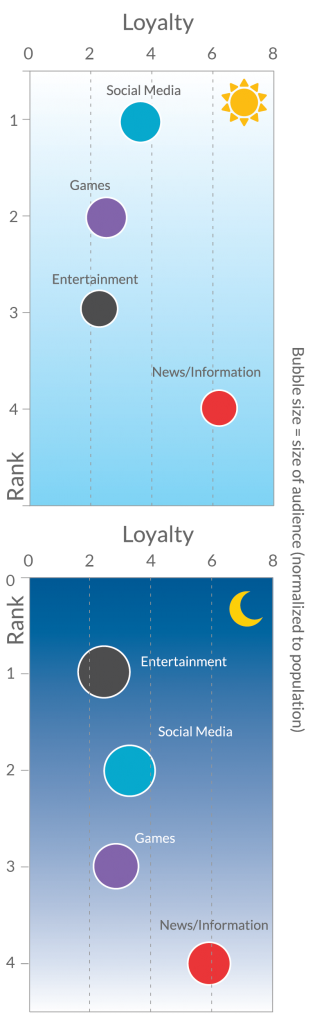
The chart here details the top apps for each time period, their relative size and their rank based on loyalty and popularity as a first or last app.
We found that there were only four app categories vying for the top position as either first or last app, and each only slightly changed its position between the morning and evening periods. These were News & Information, Entertainment, Games and Social Media.
Interestingly, though finishing a step behind the others, the app category with the highest loyalty was News & Information. This category had the most consistent first and last app of the day usage across the entire month. It also had the smallest relative change in its audience size between morning and evening.
Finally, though it did not make the cut to be in our top “first” and “last” app, the Sports category stood out as the only category where the morning audience was larger than the evening audience. As previously noted, in the United States (where the audience sample for this analysis comes from), the second quarter of the year is particularly busy for sports enthusiasts.
 Android leads in traffic and revenue generation, but iOS is still on top for monetization
Last quarter (Q1 2015), we saw Android take the top spot for revenue generation across all platforms, the very first time it had done so. This quarter, it continues to lead in revenue generation over the second place iOS, with the gap remaining less than one percentage point (47.66% vs. 47.16%). Android is also the leader in traffic, as measured by impressions.
However, when it comes to monetization potential, or the ratio between impressions and revenue, iOS still leads all device platforms. The iPad in particular generates the highest revenue per impression of any device and platform combination; its share of revenue is 4.41X that of its share of impressions.

 The rankings and metrics we see from a broad perspective, however, are not consistent across all ad types. As shown here, video advertising across both brand and user-acquisition campaigns has far more traffic and revenue generated by tablets, but there is much less variance in monetization potential. That is, the ratio between impressions and revenue is much closer to 1:1 than is the general case. This points to the high monetization potential for video across larger screen sizes, as well as its effectiveness in high-value, user-acquisition campaigns.
 When we examined the combined performance of the top two apps in each category, first and last app, Games leads all competitors in terms of eCPM but trailed in impression volume. We found that Entertainment had the largest audience, and though these users generated fewer impressions than the Social audience, they had a slightly higher eCPM.
 These apps also use very different types of ad formats to generate revenue. The Games category generates the highest relative eCPM, and much of this is due to a relatively high volume of video campaigns. The graphic here depicts how advertising formats are delivered to our top app categories.
 The mobile ad market is expanding worldwide
Mobile apps dominate the global market





No comments yet. Be the first to comment!